This post looks at the Supreme Court’s election law jurisprudence under the Roberts Court. Supreme Court opinions and applications were searched from 2005 through the present for the term “election.” All cases were examined and any that related to elections or voting procedures were maintained in the dataset. Cases were broken down across several issues including voting, counting, finance, and primaries. Several cases also dealt with other First Amendment issues surrounding elections in the vein of Minnesota Voters Alliance v. Mansky, but these were not used because these dealt with periphery issues rather than with voter participation. The breakdown of case types by frequency is as follows.

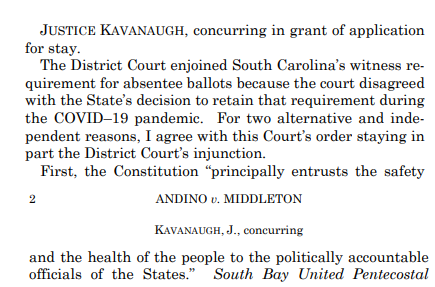
The Justices’ votes were then coded in all cases as conservative or liberal. Conservative positions deferred to state election laws in voting cases often limiting the voting population according to certain requirements. In finance related cases, conservative positions equated with those that placed fewer limits on financial contributions thus allowing more corporate interests to dominate campaign finance. There are ample examples of the different positions even in the Court’s decisions on applications for the 2020 presidential election. Justice Kavanaugh articulates this deference to state law in his concurring opinion in Andino v. Middleton.
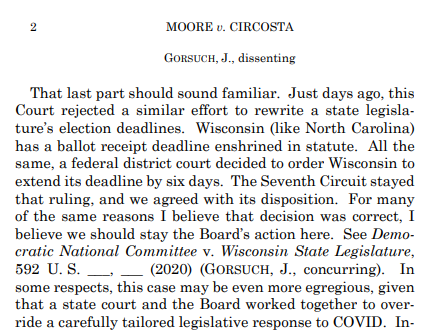
One risk of upholding state decisions though is that it can lead to inconsistent jurisprudential rules across jurisdictions. In dissent in Moore v. Circosta, Justice Gorsuch laments the different standards in Wisconsin and North Carolina and how the Court was not equally willing to sustain the constitutionality of state procedures in both instances.
The Court’s more liberal justices generally push for decisions looking to expand voter enfranchisement as is articulated in Justice Ginsburg’s dissent in RNC v. DNC.

Similar concerns were raised about voters’ health during the Covid-19 pandemic by Justice Sotomayor in her dissent in Merrill v. People First of Alabama:

Of course, these different view among the Justices far predate the current presidential election. Some might say the lines were clearly drawn in the Court’s 5-4 decision in Shelby County v. Holder which was the ultimate decision over the past decade that will have a lasting effect on the voting population moving forward. The Shelby County decision which overturned section 4 of the Voting Rights Act as unconstitutional had a majority made up of Justices Roberts, Thomas, Scalia, Kennedy, and Alito and a dissent of Justices Ginsburg, Breyer, Sotomayor, and Kagan. Many of subsequent election law decisions were made up of similar coalitions with predictable behavior on both sides of the debate.
The direction of the tide of the Court’s election law decisions is evident in the graph distinguishing the coded decisions since 2005 by ideological direction.
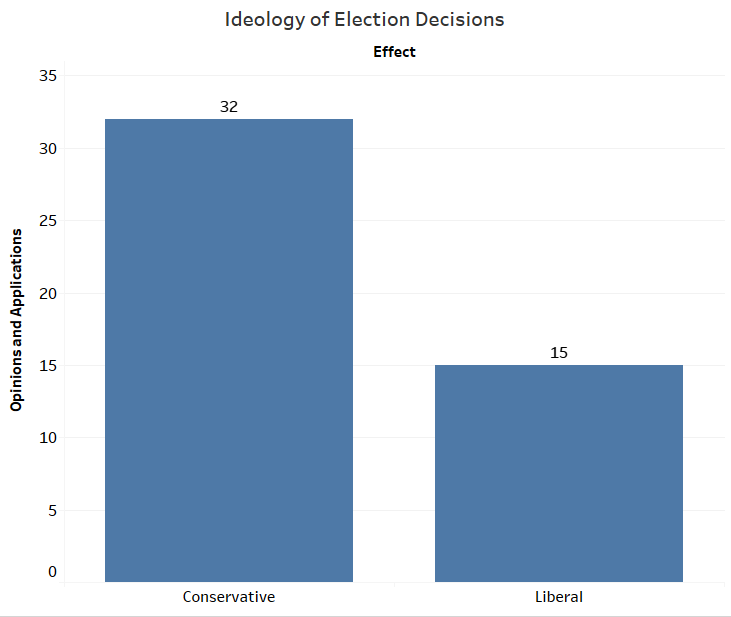
With a conservative majority in place, the Court was well positioned to move in this direction since Roberts took the helm of the Court. This initial graph shows that since 2005, the Court’s decisions in election cases have been conservative more than twice as often as they have been liberal. With the recent confirmation of Justice Barrett and the new 6-3 conservative majority of the Court, the Justices should be even more well poised to uphold state restrictions on voting that curtail the overall voting population.
The Justices’ statistics for votes in these cases reflect these deep entrenchments. The following graph breaks down the Justices votes by whether they were coded conservative or liberal. The graphs on the left show the absolute count of cases a Justice decided while the graph on the right shows the corresponding percentage of cases where the Justice voted in the conservative or liberal direction.
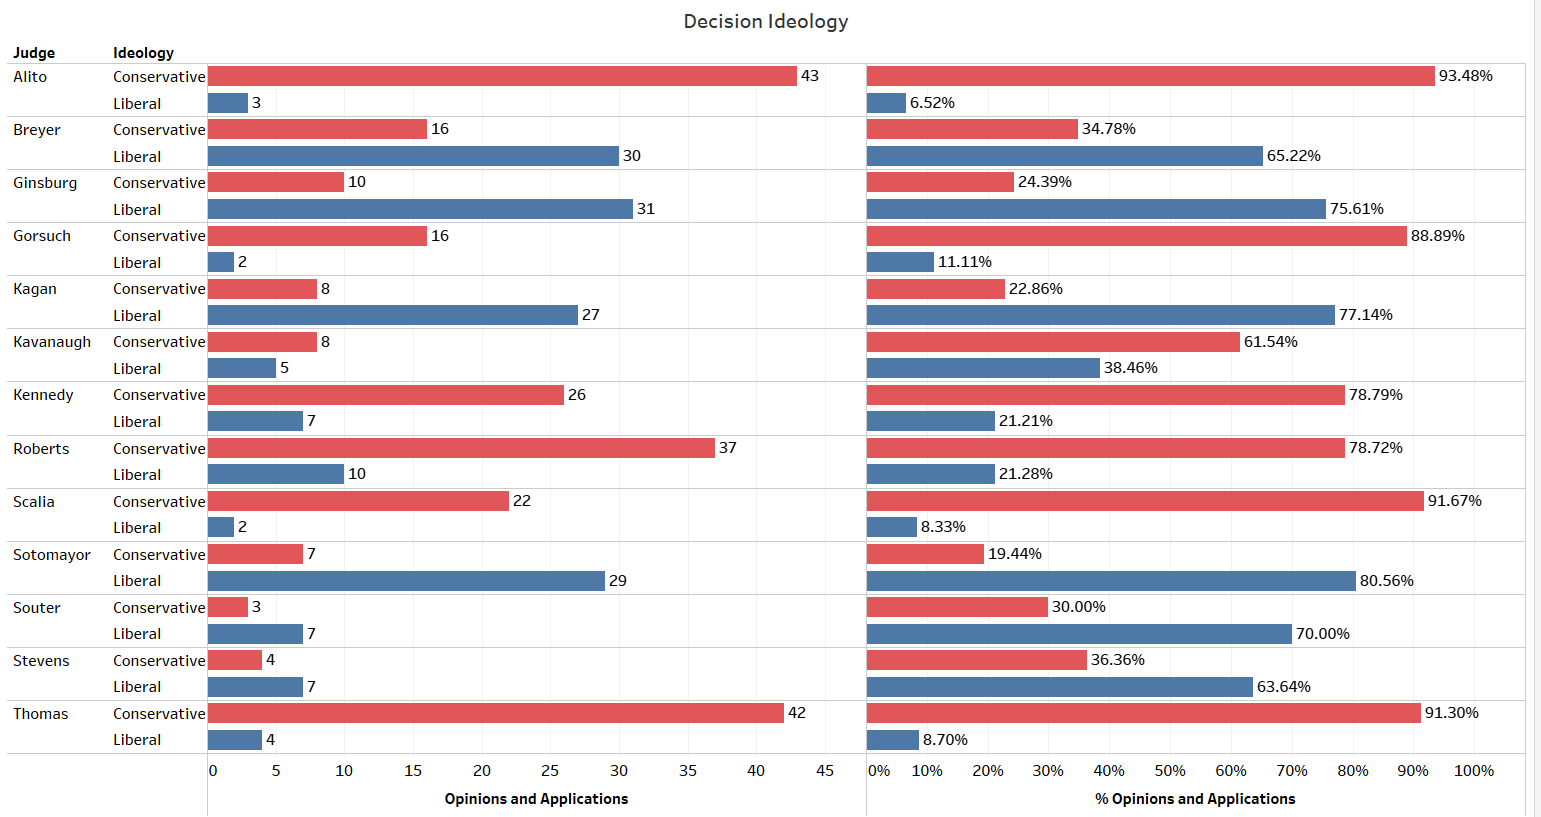
While the Court’s conservative Justices tended to vote predominately in the conservative direction, there was some variation in these votes. Chief Justice Roberts was the conservative Justice that voted in the liberal direction most often. This is interesting because Justice Kennedy voted in the liberal direction less often (and less frequently) although he is often considered more moderate than Roberts. Justice Kennedy also had a number of liberal votes. Other Justices including Alito, Thomas, and Scalia all voted in the conservative direction over 90% of the time. Gorsuch was just behind, voting in the conservative direction 88.89% of the time.
The more liberal Justices tended to vote in the conservative direction as well, at least a portion of the time. The Justice with the highest proportion of liberal votes was Sotomayor with 80.56%. This still is over 10% less in the liberal direction than the more conservative Justices voted in the conservative direction. None of the other liberal justices eclipsed the 80% marker for liberal votes. Justice Breyer has the highest fraction of conservative decisions of the liberal appointees still sitting on the Court with 65.22% liberal decisions (or less than 2/3’s liberal decisions) and 34.78% conservative decisions in these cases.
When we look at the Justices’ frequencies in the majorities, we also see that the conservative justices were more often in the Court’s majorities in these cases.

The three Justices in the majority most frequently were those with moderate conservative ideology in these cases – Justices Kavanaugh, Kennedy, and Chief Justice Roberts. All three Justices were around or above 90% in the majority in these cases. The other conservative Justices were in the majority in the mid- 70%’s of the time which proved to be far more frequent than the liberal Justices’ participation in the Court’s majorities. By contrast the two liberal Justices in the majority most frequently were Justices Kagan and Breyer whose frequencies in the majority were in the low 60% range. Although all Justices hit 50% frequency in the majority, Justices Stevens and Souter were exactly at the 50% level while Sotomayor and Ginsburg were at 55.56% and 56.01% in the majority respectively.
Justices in the majority often had alternative views on case law than the majority opinion writer leading to a high number of concurrences in these cases. The concurrence counts including votes and authorship are below.

The more conservative Justices make up the top part of this graph with Justice Thomas paving the way with 13 concurrences. Thomas is often ahead of the pack with concurrences in the Court’s cases generally, but the gap does not tend to be this wide. Justices Scalia and Alito are the other Justices with at least 6 concurrences in these cases. The only liberal Justice with at least four concurrences in these election cases was Justice Breyer. Justice Kagan and Sotomayor each only concurred one time.
These statistics illustrate the growing divide among the Court in election related cases. They also show that if the Justices split predominately by ideology in these decisions that the conservative Justices will always come out on top. That is one explanation for why we see liberal Justices voting in the conservative direction more often than we see conservative Justices voting in the liberal direction in these cases. Along with the ideology, we see from the high level of concurrences that the Justices each have distinct perspectives and flourishes which they place on the decisions to indicate more independent views of the law in these cases. Ultimately though, with the current Court and the direction it is moving, we can expect to see additional restrictions on voting rights as more state statutes curtailing the voting population are likely to be upheld by the majority of the Court.
On Twitter: @adamsfeldman

6 Comments Add yours