There have been interesting discussions as of late regarding the Supreme Court’s light workload and how it is getting even lighter. Evidence of this decline can be found in quantitative analyses of the Supreme Court’s work. It is a not a subject addressed by any member of the Court. The Chief Justice, for example, did mention this in his Year End Report on the Federal Judiciary (which had and on an annual basis generally has an appendix dedicated to workload statistics for the federal judiciary). Still, I and others have reported on the Court’s slow release of opinions this year and how in some ways the Court’s output so far this year is at a historic low. This post flesh out this low output by putting it into a historic context to show that rather than the anomaly, this rate of output should be expected from the justices as the Court has cut its workload substantially in recent decades. In fact, the rate of output this year is rather symptomatic of a larger output issue facing the justices as this is likely a downstream effect of the Court ever-shrinking caseload. In such a scenario we should not expect a strong move in the opposite direction any time soon.
The most obvious gauge of the Court’s shrinking workload is the its merits docket.
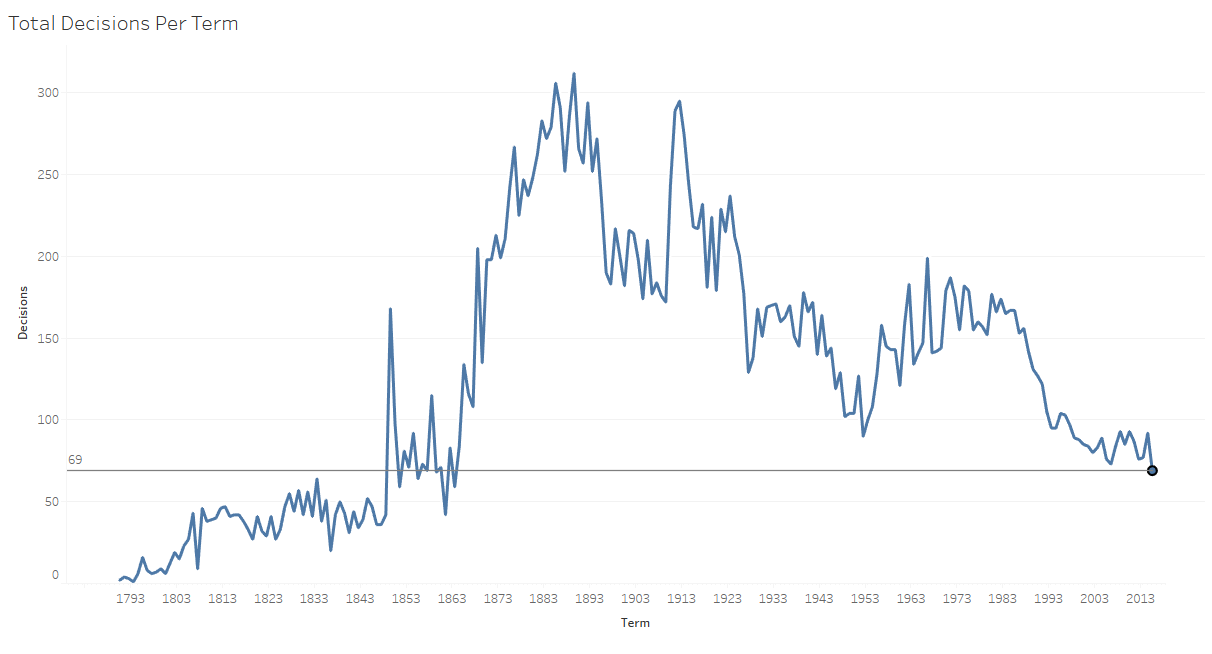
According to statistics from the Supreme Court Database, last term the Court released fewer decisions than it has since the 1860’s. The decline to this level has at times been precipitous, although it appears more gradual in recent years. This appearance, however, is related to the fact that the Court is down to so few cases already, there are not many more that it could credibly shed on an annual basis.
The previous graph looked at all of the Court’s decisions by term. The next breaks down the decisions by decision type to see how this helps to explain the Court’s decreasing caseload.
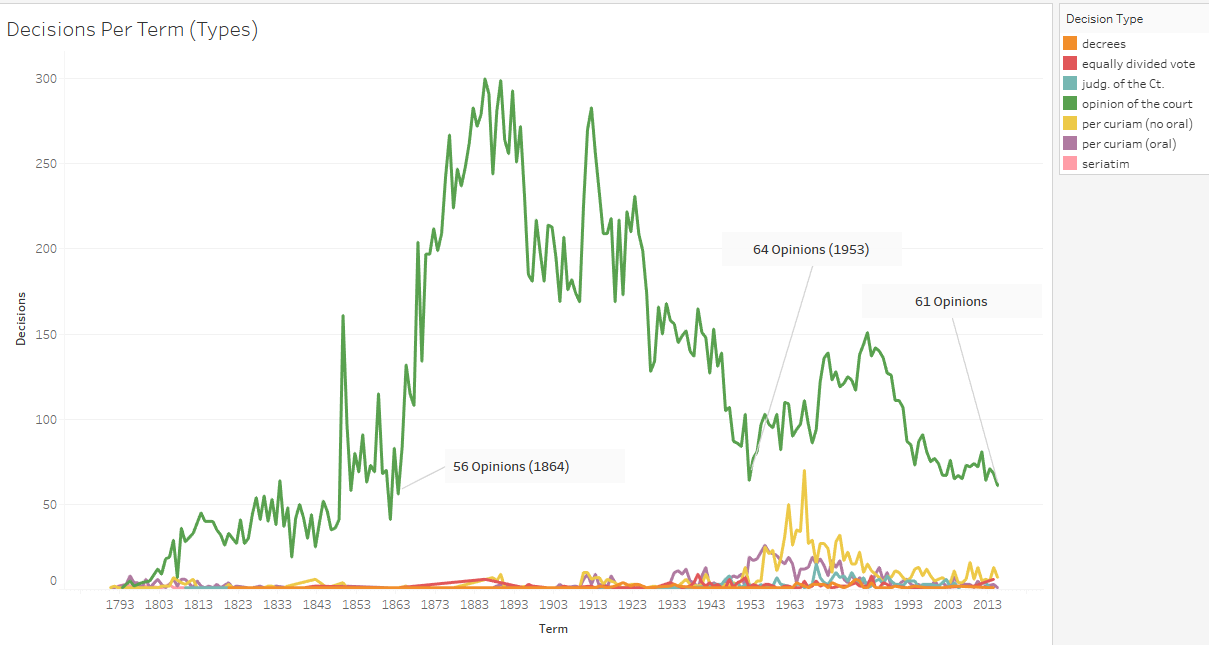
The Court released 61 signed opinions last term. This was the Court’s lowest number since 1864 although the Court was close to this mark in the mid-20th century. The big difference in the mid-20th century was that the Court supplanted many signed decisions with per-curiam opinions. While such opinions don’t have signed authorship and so in some sense they may lack the same persuasive power as signed opinions, the balance of per-curiam opinions at the time at least provided some indication that the justices were shifting the use of their time from one type of opinion to another. The only opinion types that seem to at all substantial in the longer timeline aside from signed opinions are per curiams and judgments of the Court.
One explanation for the decline in caseload has to do with the Court’s appellate jurisdiction. Historically the much of the Court’s jurisdiction was mandatory, yet at this time the Court only hears about one appeal a year on mandatory jurisdiction (interestingly enough, a case this term will look at another possible avenue for mandatory jurisdiction).

Looking at most of the types of the Court’s jurisdiction across time it is obvious that discretionary jurisdiction in the form of cert overtook mandatory types of jurisdiction – mainly appeals and writs of error – in the mid to late 1920’s. Prior to 1900 the Court hardly heard any cases on cert.
Zooming in a bit closer, we can see that less utilized forms of jurisdiction have played roles In the Court’s docket over time as well.
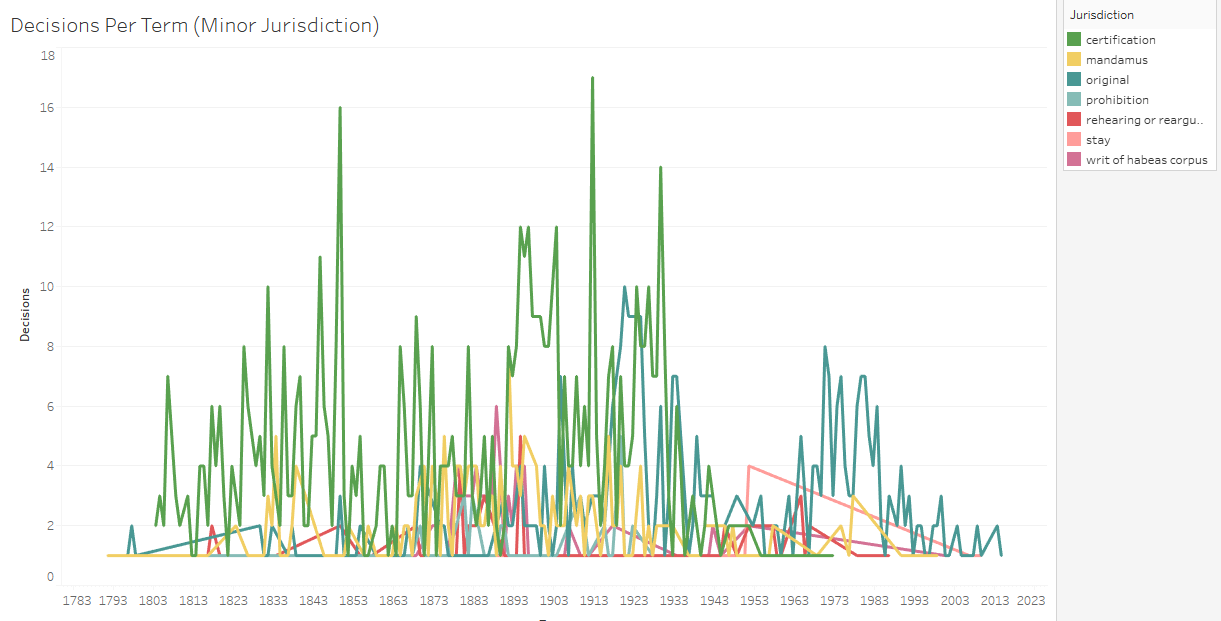
After removing appeals, writs of error, and cert, the next most prominent form of jurisdiction is certification of questions to the Court. This form has all but disappeared in recent years. Aside from the occasional cases the Court takes on original jurisdiction, these lesser used forms play little role in explaining the Court’s caseload.
While these mechanisms for taking and deciding cases have an impact on the Court’s declining caseload, so do the types of cases the Court takes. While the types of cases do not cause the diminished docket, they parallel the decline in the Court’s overall workload and help to explain how the Court’s business has shifted in this era of a light caseload.
The bases of the Court’s decisions may have affected the number of cases the justices hear annually.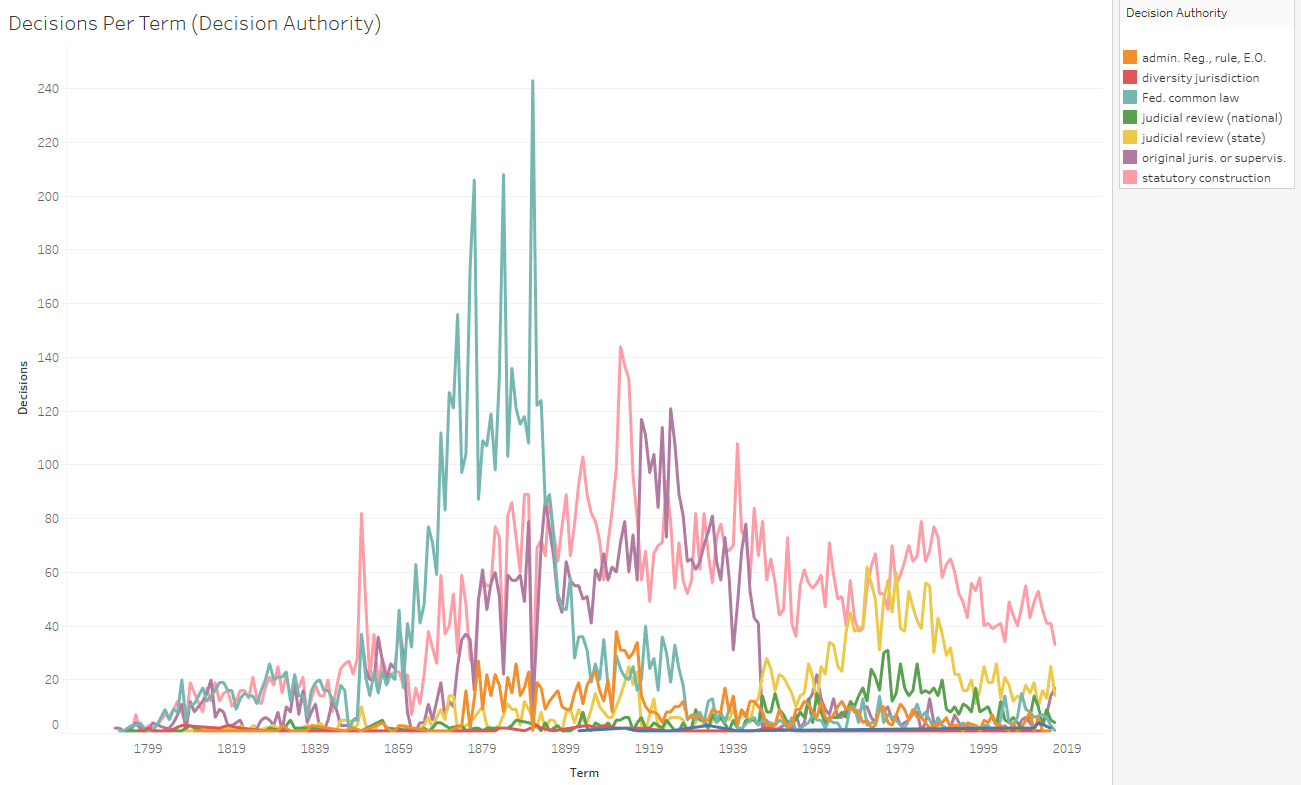
Historically, the Court heard many more federal common law cases as well as cases based on its supervisory role. During the mid to late 20th century, the Court also saw an uptick in state judicial review cases. Since the turn of the 20th century though statutory construction cases have dominated the Court’s docket. These cases make up the bulk of the Court’s current merits docket (they also were the subject of a discussion in a prior post about the justices’ textualist interpretation strategies). Looking at the Court’s decision authority since 1985, the prominence of statutory construction cases is even starker.
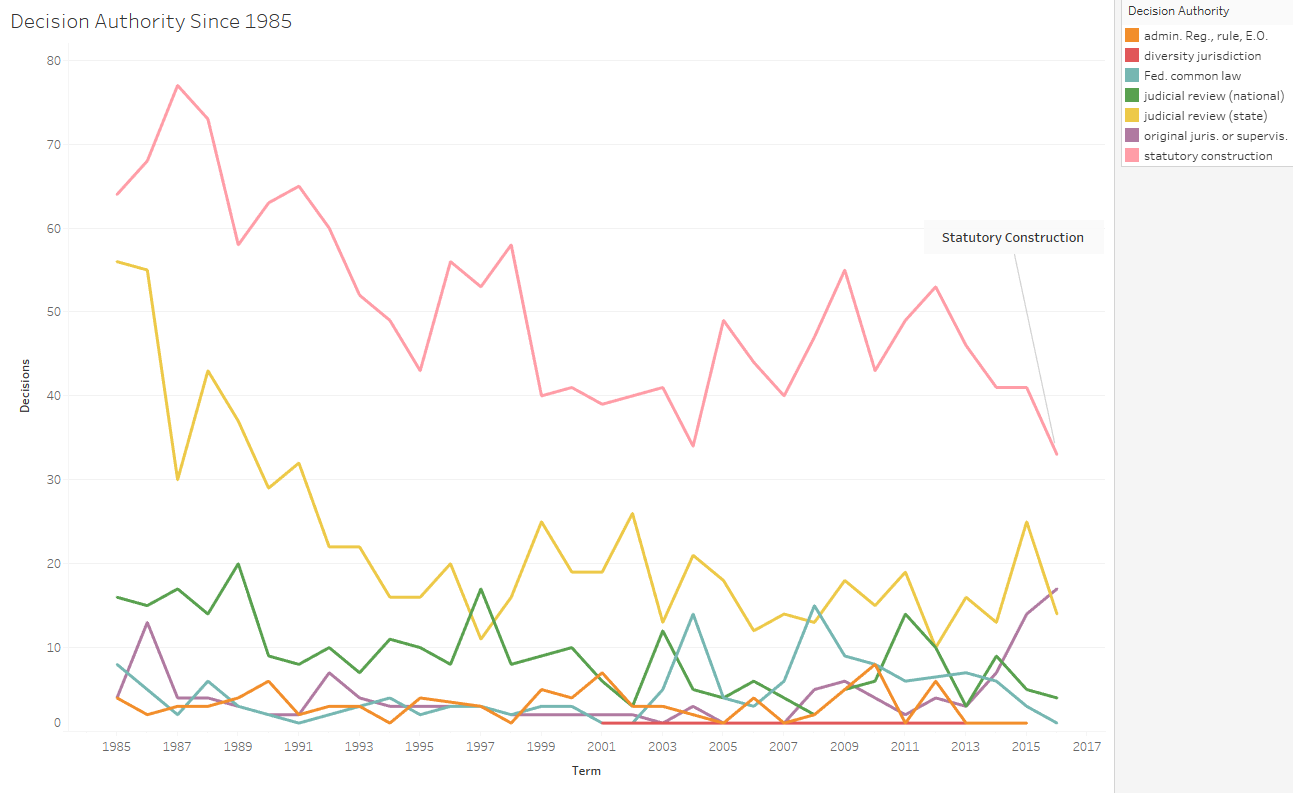
Statutory construction cases make up about twice as many cases on the Court’s docket as the next greatest area of decision authority – state judicial review. Also, all areas are on the decline except for original jurisdiction / supervisory cases. If the justices spend more time on each statutory construction case than on other case types, this might help explain some of the diminished docket.
The source of cases coming to the Court has shifted dramatically since the Congress amended the Court’s jurisdiction to be predominately discretionary as the Court began to take a majority of its cases from the federal courts of appeals.

While prior to the ascendance of cert the Court heard most of its cases from State Supreme Court and many also from the Court of Claims, now the Court hears the majority of its cases from a smattering of Courts of Appeals due to circuit splits (since they only further convoluted the picture, I removed the historic court circuits from this graph). While cases from the Ninth Circuit clearly stick out, the other circuits tend to blend together in this graph as the Court typically takes a mix from each one. Increased case complexity due to circuit splits (among other things) may factor into the amount of time the justices spend on each case.
When we look at the major players before the Court, we can see dramatic shifts as well. The following graph shows the types of petitioners with 12 or more cases before the Court in a given term.
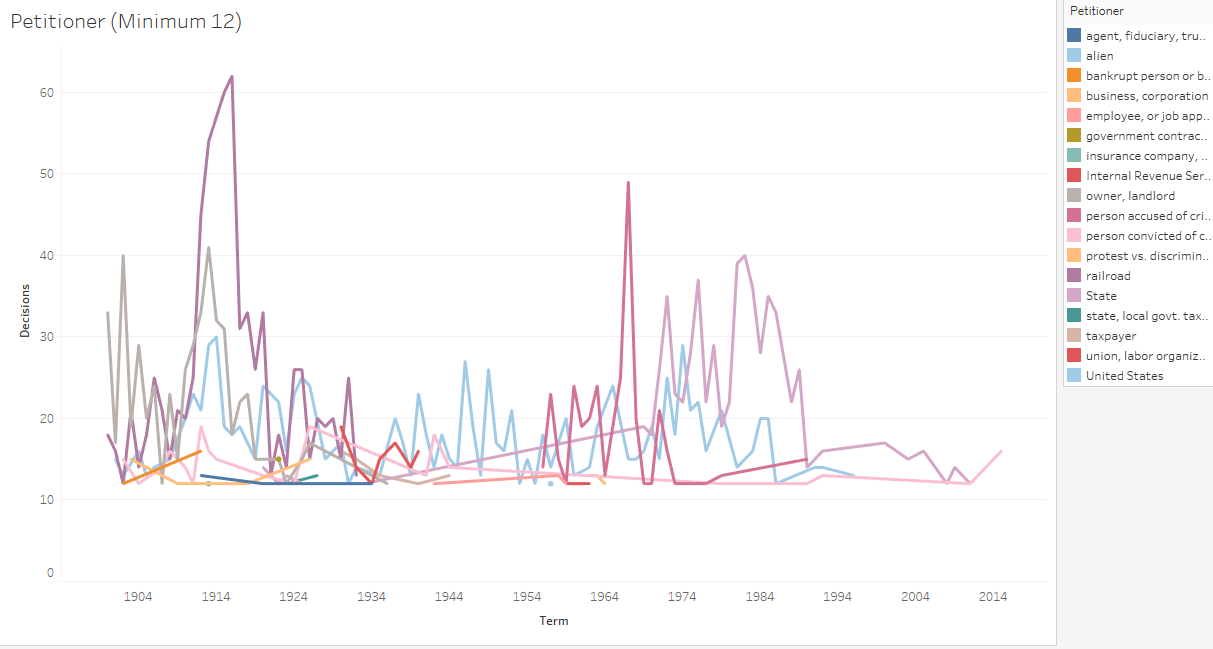
While plaintiff types with 12 or more cases were more prevalent in the past, the only repeat players types in recent years with this type of regularity are those accused and/or convicted of crimes. In the past railroad cases and cases with the U.S. as the petitioner tended to dominate the Court’s docket. Such repetition in case type may have led to more streamlined decision making.
The previous graph and some of the others that come next indicate that the Court used to take more cases that overlapped on multiple dimensions. In the past, for instance, the Court regularly heard 15 or more cases per term dealing with certain specific issues.
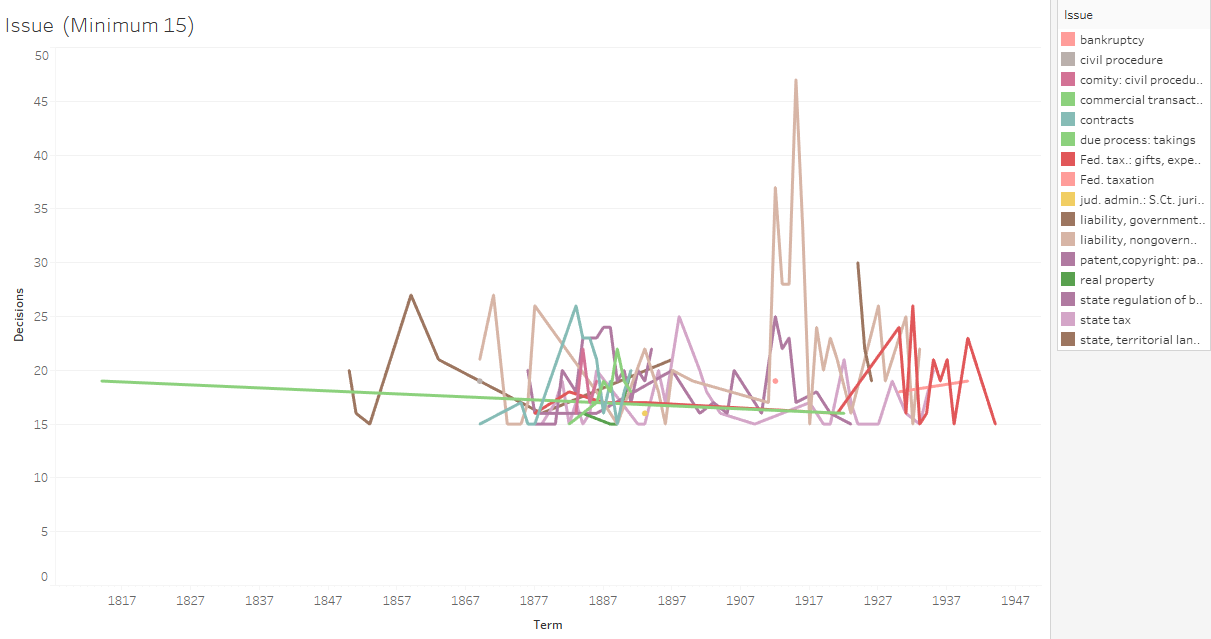
The most recent of these issues was federal taxation although non-governmental liability cases were the most prevalent type per term when these spiked around 1910. Since the late 1940’s and with the elimination of most of the Court’s mandatory jurisdiction, the Court has not heard 15 or more cases within any single issue.
Since the Court’s caseload has diminished so greatly over the years, it is unlikely the Court will get near this mark of 15 or more cases surrounding one issue in a term anytime soon. When we drop the number of cases per issue to four and shrink the time frame to between 1985 and the end of last term, other nuances become clear.
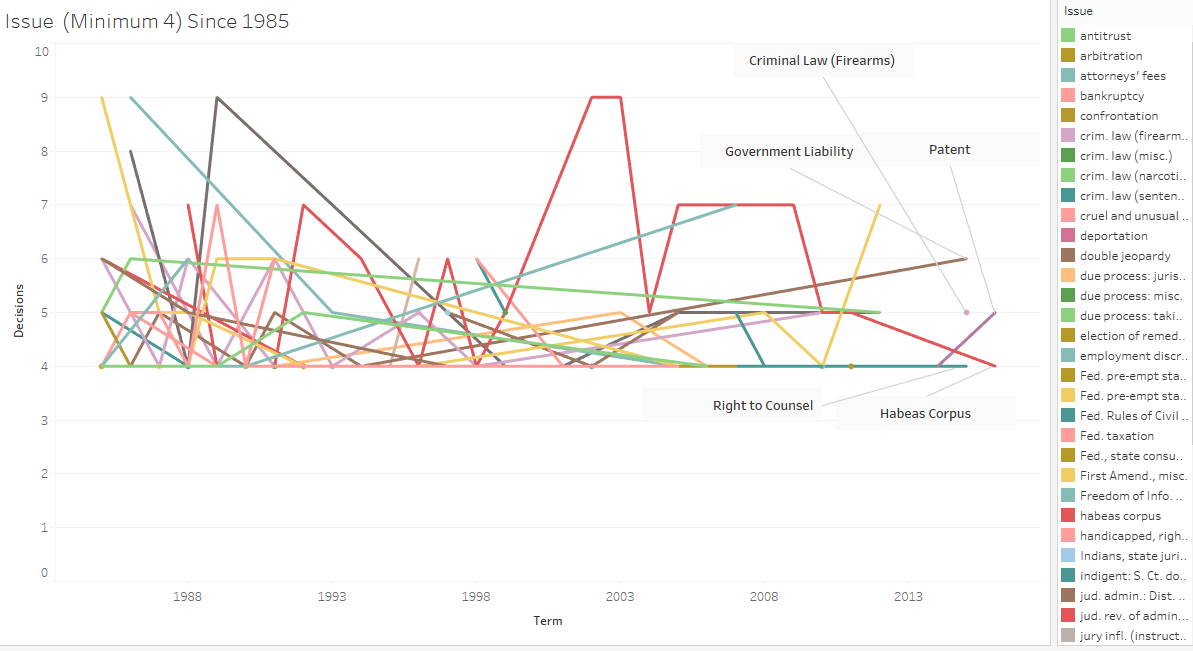
The first obvious thing in this graph is that even a decade or so ago the Court used to hear four or more of many types of cases per term (the list on the right side of the graph goes even lower than is visible indicating the Court used to hear four or more cases per term about specific issues not terribly long ago). Now the Court hears relatively few with patent and habeas corpus cases the only types it heard in this amount last term.
I suppose all of this data leads to the question of whether changes to the Court’s docket over time explain the decline in caseload and long wait times until opinions are released. The answer is probably not entirely but perhaps to a certain extent. Historically, the Court heard many more cases on mandatory jurisdiction and with overlapping themes. This forced the justices to take a certain number of cases each term and gave the justices templates for various opinion types. Also, when the justices needed to author 200 or more opinions in a term, the average opinion was typically short. Now we have longer majority opinions and oftentimes multiple separate opinions. The justices, however, have more clerks now then they ever had historically and so there are many more bodies to complete the tasks at hand. This leads me to believe that without further incentivizing the justices to take more cases on an annual basis, there is little reason to expect the justices to move more swiftly through their decisions or to hear a substantially greater number of cases each term.
On Twitter: @AdamSFeldman

6 Comments Add yours