The Solicitor General’s Office (OSG) has a special relationship with the Supreme Court. In the role of adviser the Solicitor General is often referred to as the 10th Justice. The OSG enjoys much higher than average success in bringing cases to the Court and is even asked to give its opinions on whether the Court should hear cases when it is not directly enmeshed in them.
The OSG is also regularly noted for its success in winning cases, especially on behalf of its most frequent client – the United States. In an article published nineteen years ago, Professor Kevin McGuire described, “The federal should win because of these various advantages; the federal government, in fact, does win; the solicitor general, therefore, must indeed be a uniquely situated litigant who enjoys a special relationship with the justices.”
Historic Comparison
By contrast, in a recent post I described how the OSG was not faring as well in the Supreme Court as it had in the past. That post only reviewed the recent dip in the OSG’s success before the justices. Looking across the history of the office though, the OSG’s success during the Obama Administration was not only at a recent low, but also at a historic low. Along these lines Professors Lee Epstein and Eric Posner wrote of the OSG under President Obama in a recent article, “This is the worst record of any president in our dataset; and it may be the worst since the Zachary Taylor administration, which ended in 1850.”
In one respect, this supposition can be confirmed and even extended. Data from the United States Supreme Court Database shows that as a representative of its main client, the United States, the OSG’s success rate was lower during the Obama years than it was during any administration since the Office of the Solicitor General was created in 1870. In fact, the United States was represented by the Attorney General (OAG) the last time it had a lower success rate, which was, as Epstein and Posner describe, in the late 1840’s under President Zachary Taylor. The OSG’s/OAG’s success rate representing the United States under the different presidential administrations is provided in the figure below:
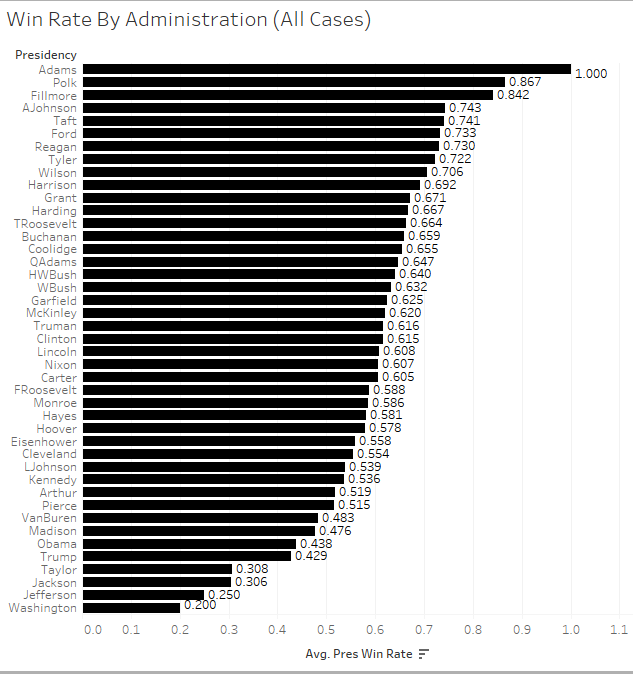
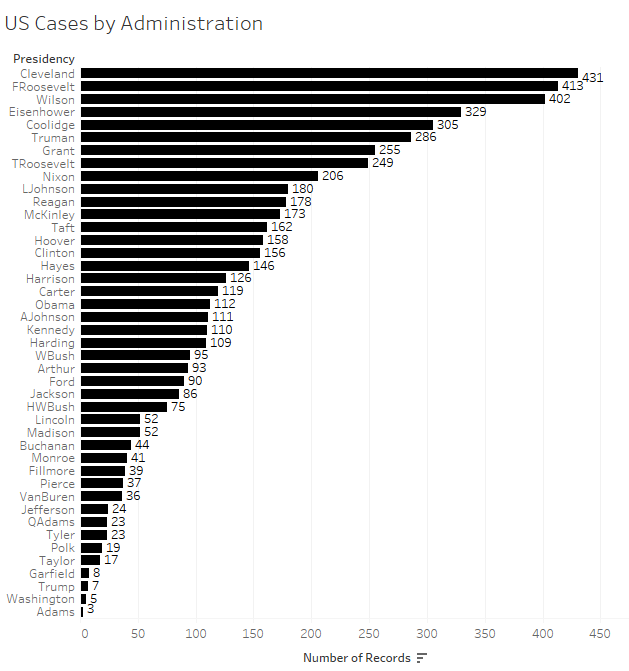
The figure also shows how thus far the OSG under President Trump has not fared any better. If we discount the OSG under administrations that did not complete at least one term (Trump is in his first term and the Taylor administration only lasted a year before President Taylor died in office) then the last time the Justice Department had a success rate representing the United States lower than the OSG had during the Obama years was in the 1830’s under President Andrew Jackson. The figure below has case counts for the number of cases the OSG or OAG represented the United States during each presidential administration.
We might discount the success rate of the OSG or OAG during administrations when it only represented the United States in a handful of cases. This includes the top and bottom success rates of the Washington and Adams presidencies where the governmental institutions were only beginning to take shape. Looked at in this way, the most successful representations of the United States took place during the presidencies of Millard Fillmore and Andrew Johnson.
We can begin disentangling how we ended up in this space with the OSG by looking at a graph of the OSG/OAG’s success representing the United States over time on a per term basis.
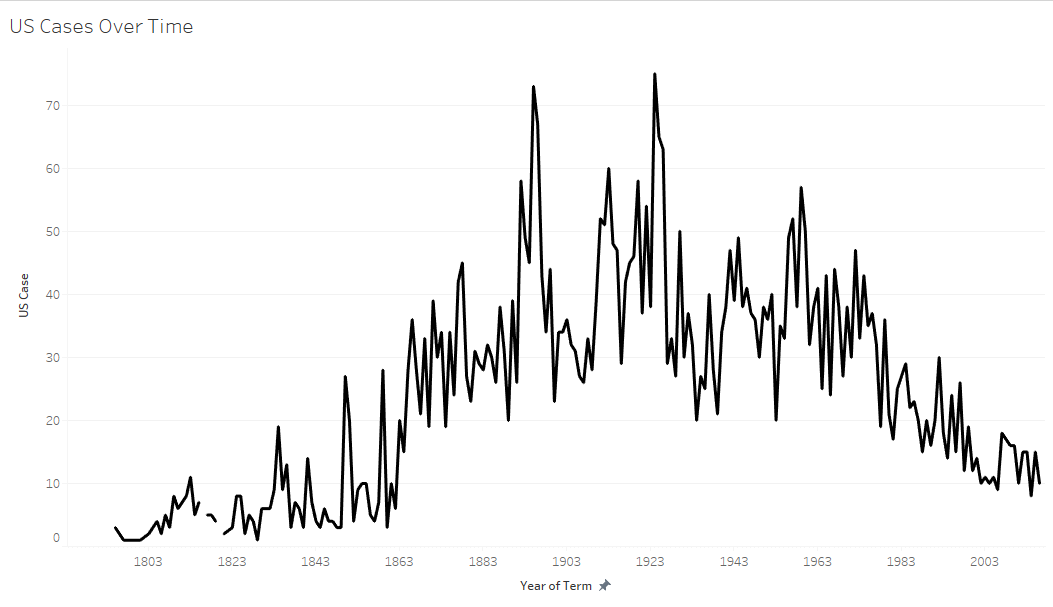
This graph shows that the OSG/OAG increased in its success until it peaked around the late 19th and early 20th centuries. Since the late 1920’s the OSG’s success representing the United States has steadily declined. This does not portend well for the OSG under President Trump, however, the jagged nature of this graph shows that one administration’s success does not necessarily assure the success of a subsequent administration or lack thereof.
Justices
Part of the reason for the decline in success rate may have to do with case count. As the second graph conveys, the OSG/OAG had more attempts before the Court in earlier years. We also see this with respect to the individual justices. Looking at the justices who wrote the most majority opinions in cases involving the United States, Justice Rehnquist is the only justice from a recent Court.
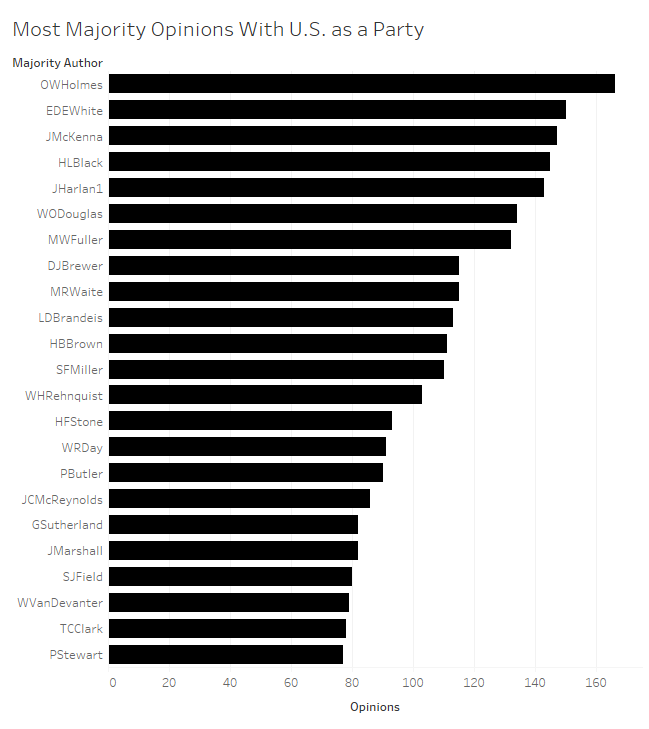
Of all the justices, Justice Holmes who sat on the Court from 1902 through the beginning of 1932 wrote the most opinions involving the United States followed by Justice Edward White who sat on the Court from 1894 through 1921.
This list looks somewhat different when we look at the justices who wrote the most majority opinions where the United States was the losing party.
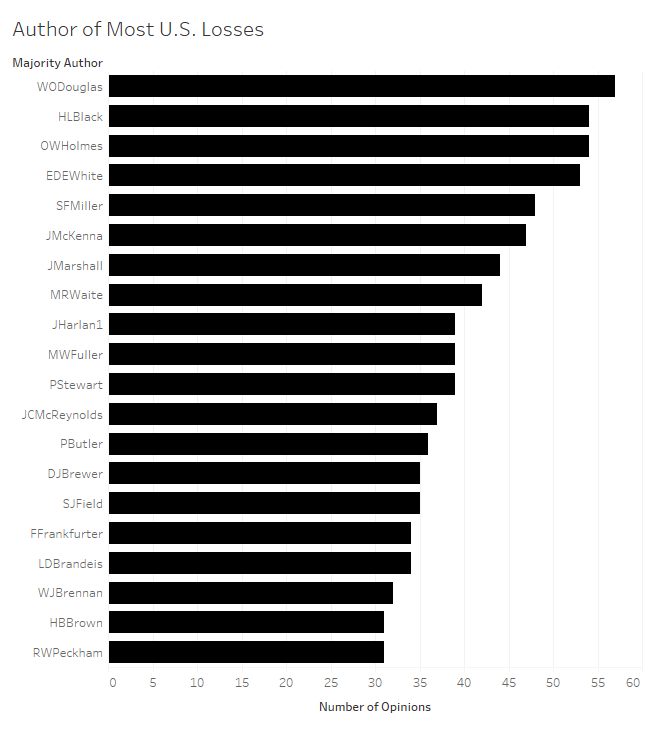
In this chart Justice Holmes falls to third with two more recent justices, Justices Douglas and Black, writing more majority opinions where the U.S. was the losing party than any of the other justices. Justice Rehnquist is no longer present when we look at the justices who wrote the most majority opinions where the United States was the losing party in absolute terms.
Although absolute counts provide interesting historic data, the more recent justices can only be justifiably compared by their rates of writing majority opinions in favor of (or against) the United States. Based on the rate trend in the time graph, it should not be surprising that modern justices have been less likely to write majority opinions in favor of the United States than their predecessors. This is apparent in the graph of the justices that wrote majority opinions in favor of the United States the most frequently.
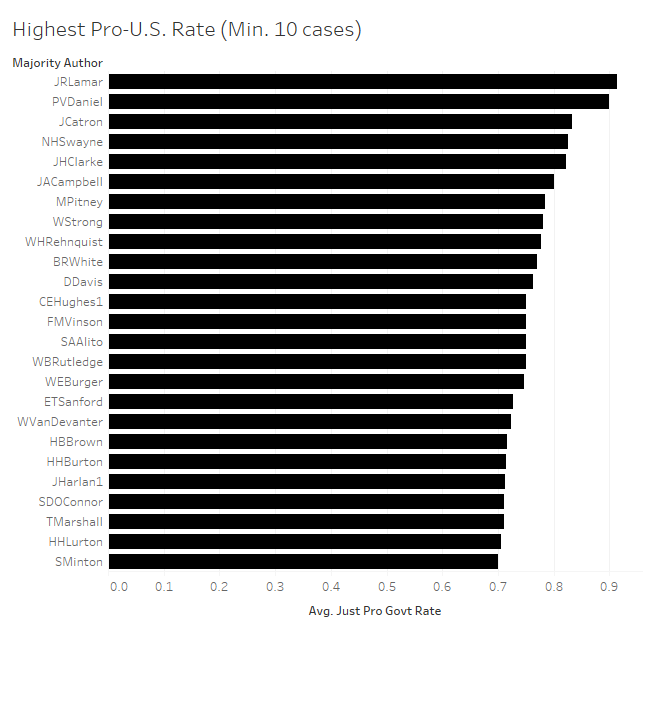
Here we see Justice Joseph R. Lamar who sat on the Court from 1910 through 1916 was the most favorable justice towards the United States as his majority opinions were 91% in favor of the U.S. He is followed by Justice Daniel at 90% who sat on the Court from 1841 through 1860. Justices Rehnquist and O’Connor are the modern justices that wrote opinions that favored the United States’ position most often. Justice Rehnquist’s majority opinions favored the United States 78% of the time while Justice O’Connor’s favored the U.S. 71% of the time.
Ironically the justice that wrote majority opinions opposing the United States positions’ most frequently was also a Justice Lamar – this time Justice Lucius Q.C. Lamar.
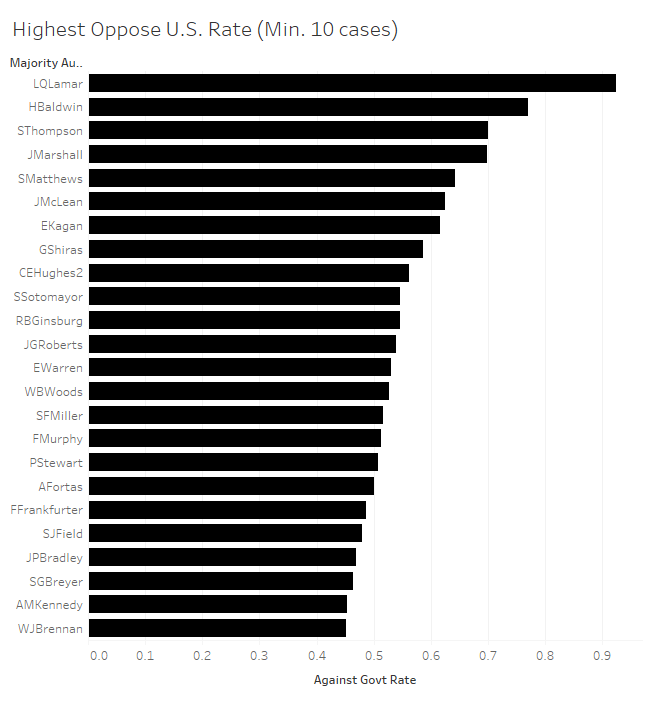
While this field of justices is still dominated by those far in the past (Justice L. Lamar sat on the Court from 1888 to 1893, Justice Baldwin from 1830 to 1844, and Justice Thompson from 1823 through 1843), there are several current justices in this mix. Of the current justices, Justice Kagan has the lowest rate of opinions supporting the U.S.’ positions with a rate of 62% of her majority opinions in opposition to the U.S.’ positions. Justices Sotomayor, Ginsburg, and Roberts are not far behind with 55%, 55%, and 54% of their majority opinions favoring the U.S’ opposition. Justice Kennedy is towards the bottom of this list of justices with 45% of his majority opinions favoring the U.S.’ opposition.
Focusing specifically on the modern justices, there are some clear characteristics of justices’ with the most majority opinions supporting the U.S.’ positions. The following graph charts the modern justices beginning historically with Justice Rehnquist.
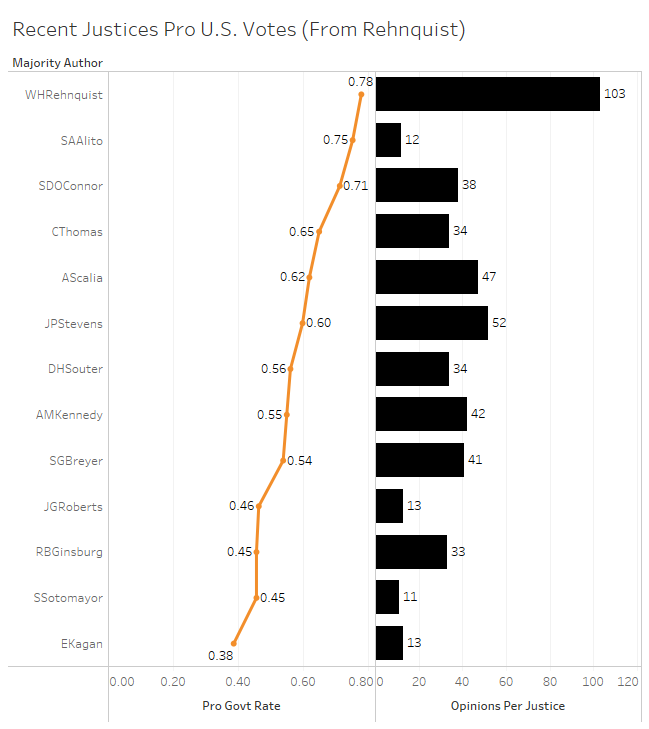
The tendency in this graph is for justices support for the U.S. to increase relative to the number of opinions they wrote in cases involving the U.S. There are anomalies in this respect with Justice Alito supporting the U.S. with a high rate of his opinions although he has only authored twelve such decisions. Still, Justice Rehnquist who wrote the most majority opinions in cases involving the U.S. was also the U.S.’ greatest supporter with 78% of his majority opinions favoring the U.S.’ position.
Another clear delineation among the justices is by ideology. Excluding Justice Roberts, republican nominees to the Supreme Court all favored the U.S.’ positions with their majority opinions at higher rates than their democratic appointed counterparts. There is also an ideological delineation with four of the most conservative justices, Justices Rehnquist, Alito, Thomas, and Scalia supporting the U.S. with their opinions most frequently, while the most liberal justices including Justices Kagan, Sotomayor, Ginsburg, and Breyer have some of the lowest rates of support for the U.S.’ positions with their majority opinions.
Explanation – Things Change
As Epstein and Posner note in their article, various changes to the Court may be responsible for this decline in support that bottomed out (so far) with the OSG under President Obama. These characteristics may have to do with ideological factors. The Roberts Court under President Obama, for instance, had a conservative majority. This combined with a low case count where all opinions have a large impact on the rate of support for the U.S. may have helped this decline along.
The types of cases involving the U.S. before the Court has also changed dramatically over time. Looking at the broad case issue areas some of these changes becomes apparent.
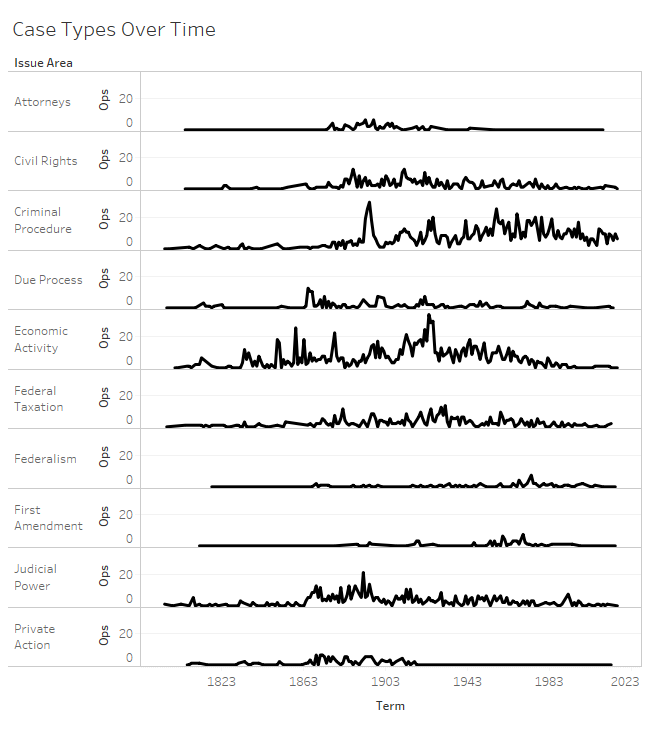
While criminal procedure cases are the case type involving the U.S. the Court has heard most frequently in the 20th century, this was not always the case. Cases involving economic activity, judicial power, and federal taxation with the U.S. as a party were all more prevalent in the past. Even private actions involving the government were heard more frequently up until the turn of the 20th century. This all goes to show that the Court is not looking at the same cases involving the U.S. as it did in the past and in the same amounts. The Court is also not the same as it once was with current ideological positions more defined than they were in the past. Even the number of seats on the Court has changed over time.
When looking at the success rate of the Obama OSG representing the United States in a historical context, we must ask are we comparing apples to apples. Put another way, distinct differences in the Court’s institutional dynamics may be responsible for these changes.
There are also methodological issues which deserve some attention. The Supreme Court Database relies on individuals’ coding for the winning party and for the direction of the Court’s majority opinion. Sometimes these factors cannot be boiled down to a binary measure as well as at other times. Although this likely did not drastically affect the results, it is a reason to take the actual statistics with a grain of salt. Even so, the Court clearly hit a low in its support for the OSG when representing the U.S. under the Obama Administration, and if it continues at its current rate, its support for the current administration’s OSG will be even lower. Since this is the first full Supreme Court term during the Trump Administration the Court’s relative support for the U.S.’ current positions will become much clearer in the coming months.
—
On Twitter: @AdamSFeldman

18 Comments Add yours